
DMI · Device & Market Intelligence
Analyse your sector and competition easily
All indicators for over 2 million applications, across more than 49 sectors analysed monthly. Data collected daily from real mobile users, and presented through multiple use cases.
Who trusts us
Indicators and use cases that drive decisions
Share, usage, users and store reputation on one platform. From question to answer in a few clicks, with every indicator built for a concrete use case.
Share
- Market share
- Sector share
- +4 indicators
How much of the market and of its sector each app reaches, and how that changes month by month.
Am I gaining or losing ground against my competitors?
Usage
- Frequency
- Time spent
- +7 indicators
How often each app is opened and how much time its users spend in it.
Do people use my app every day, or just keep it installed?
Users
- Exclusive users
- Affinity
- +2 indicators
How many users are yours alone, how many you share with other apps, and with which ones.
Which other apps do my users share?
Store
- Downloads
- Review sentiment
- +4 indicators
What happens in the app stores: how often each app is downloaded and what people think of it.
What do people say about me compared with the rest?
Share
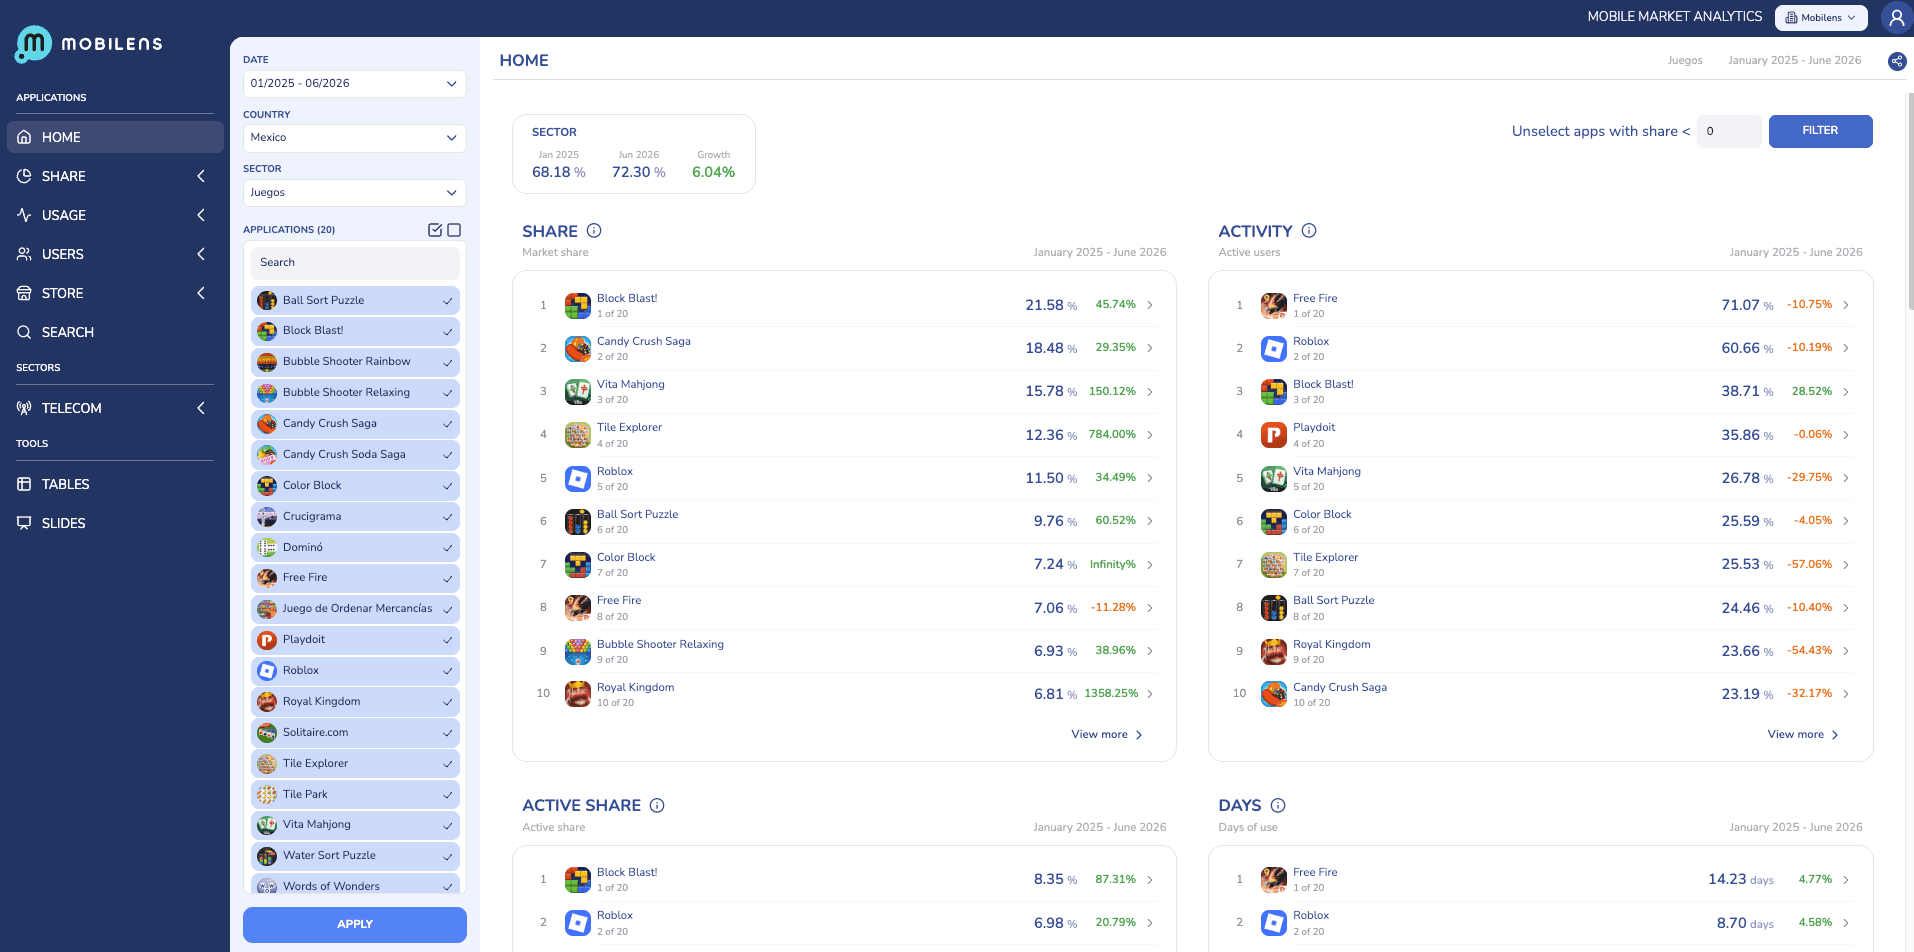
Know who is winning and who is losing in your sector
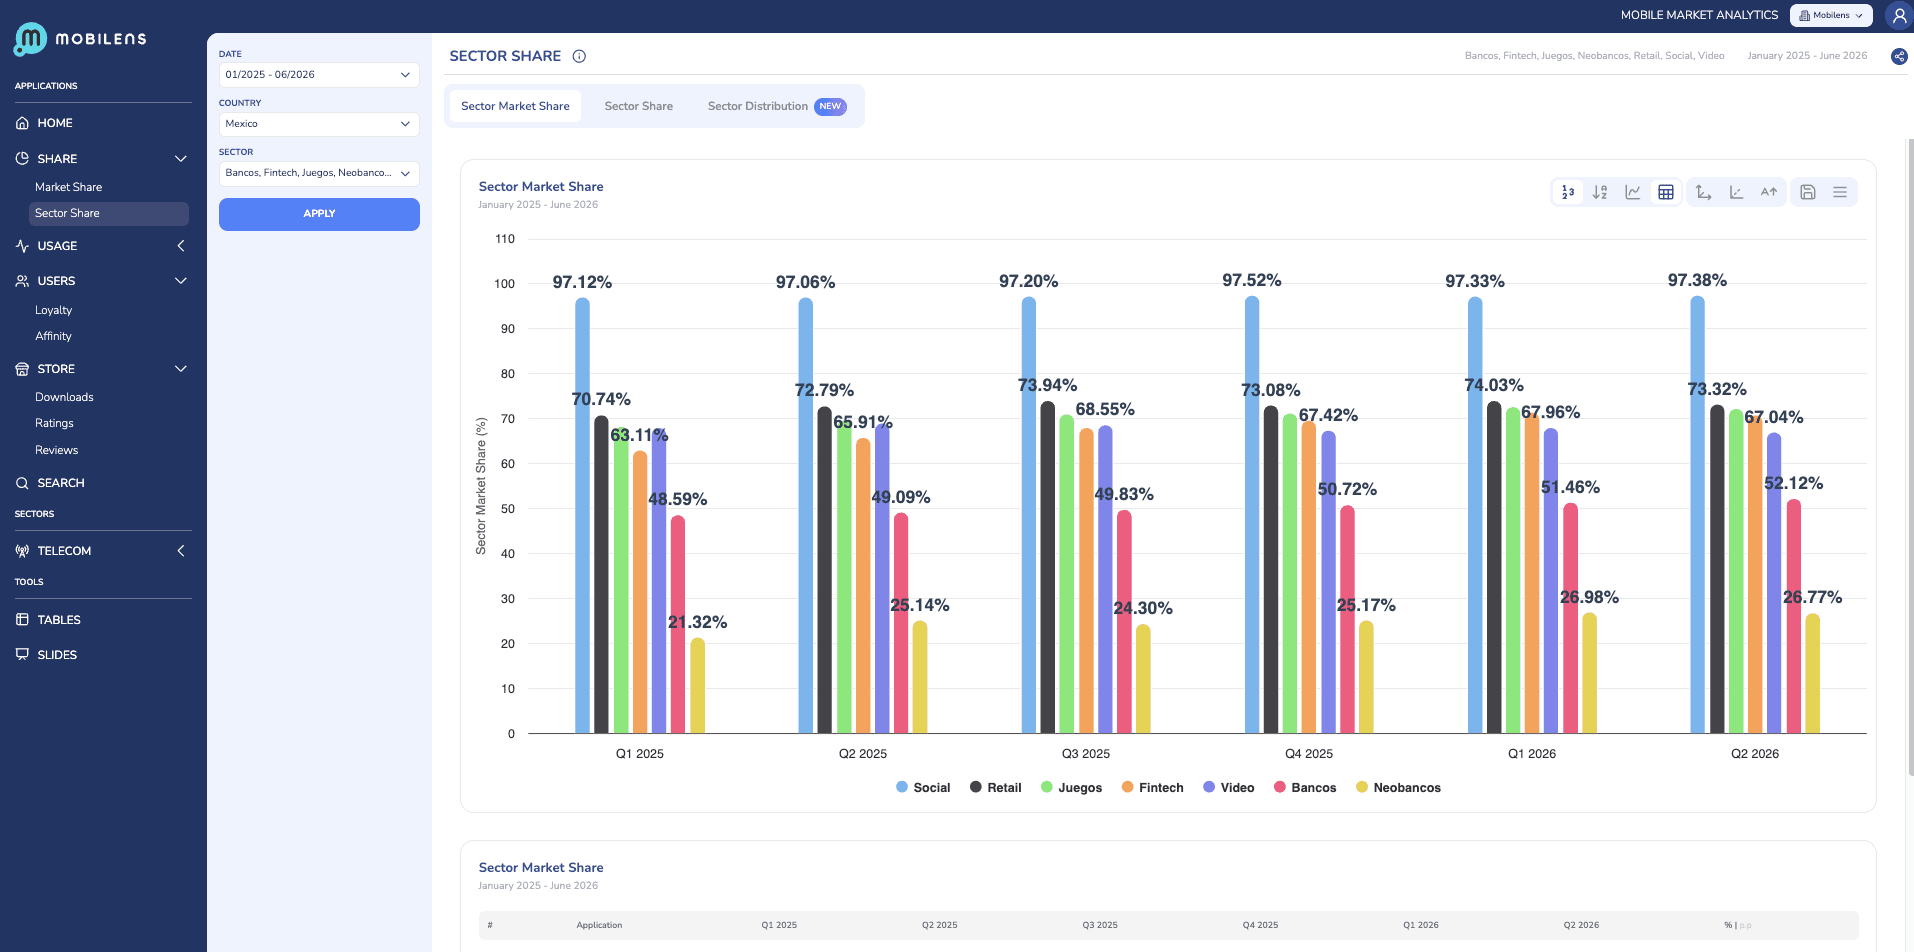
The real penetration of each app in its market and within its sector, with historical series to see the trend, not just this month's snapshot.
- Market share and share within the sector, app by app.
- Month-by-month evolution, to spot early who is speeding up and who is slowing down.
- Sector loyalty and affinity with other sectors, to analyse the threat and opportunity.
Usage
Installed does not mean used
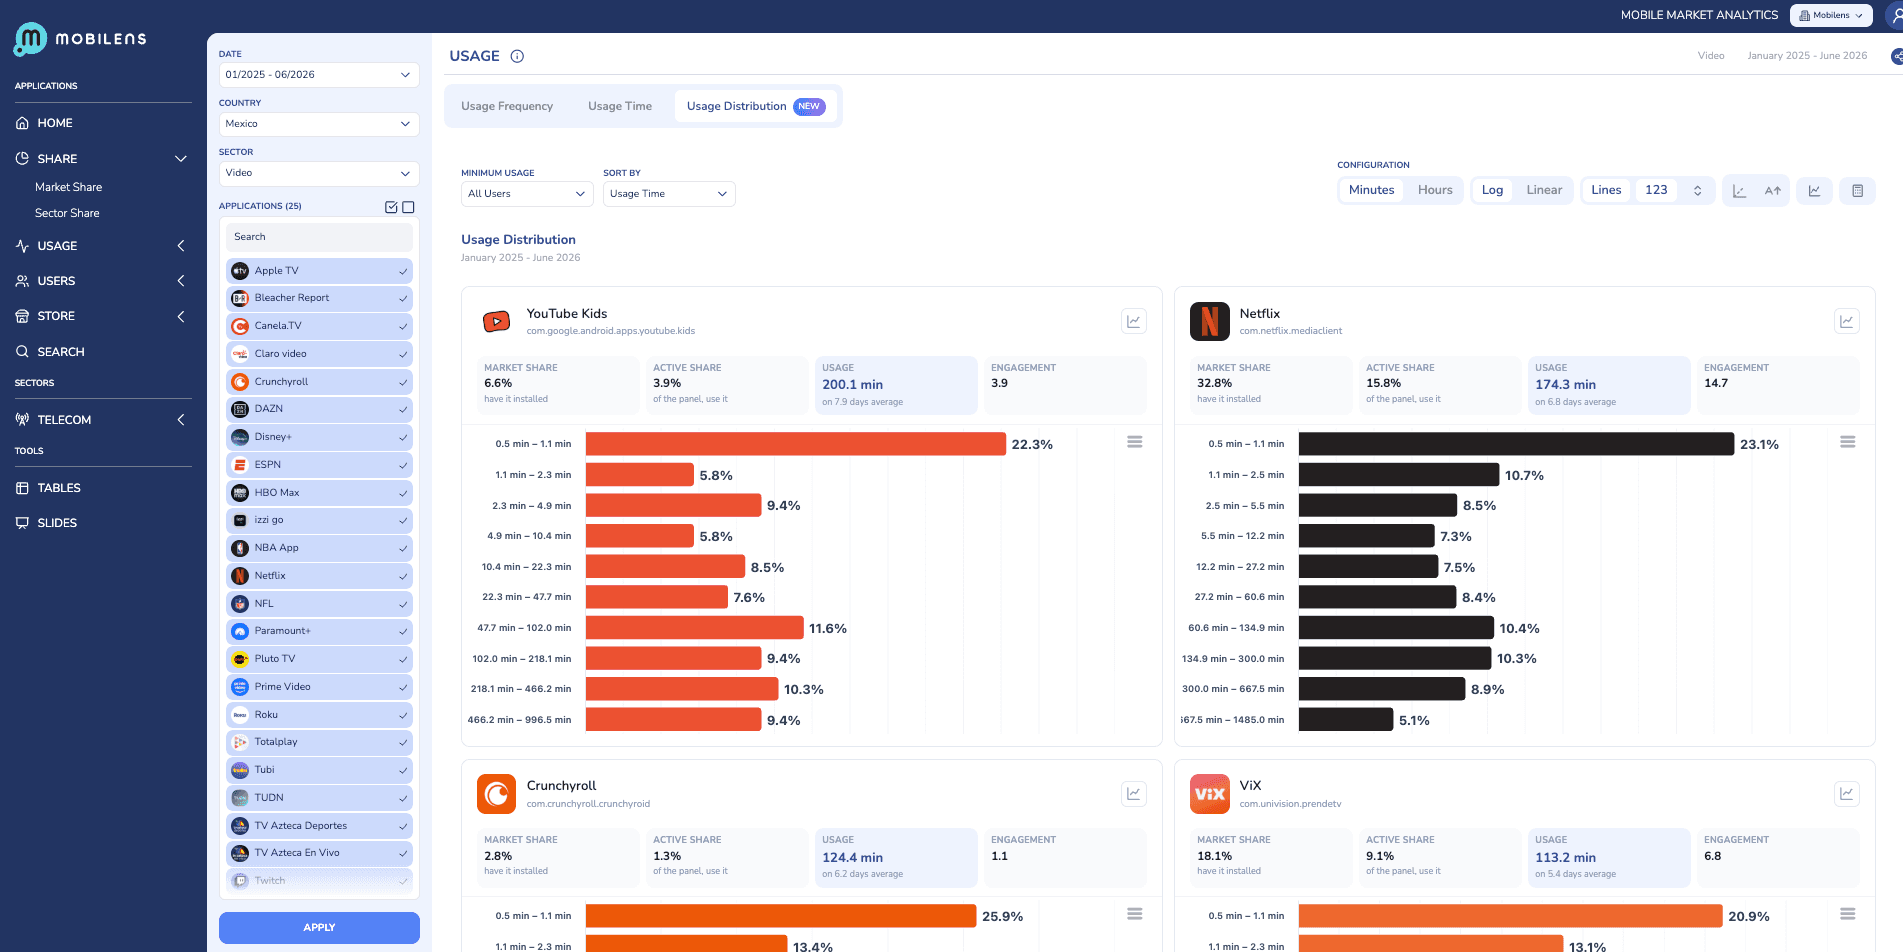
An app can sit on millions of phones and hardly ever be opened. Mobilens measures usage frequency and time spent, which is what separates an essential app from a forgotten one.
- Frequency: how often the app is opened.
- Time spent: how much time its users give it.
- Comparison with the sector average and with each competitor.
Users
Know your users by the apps they use
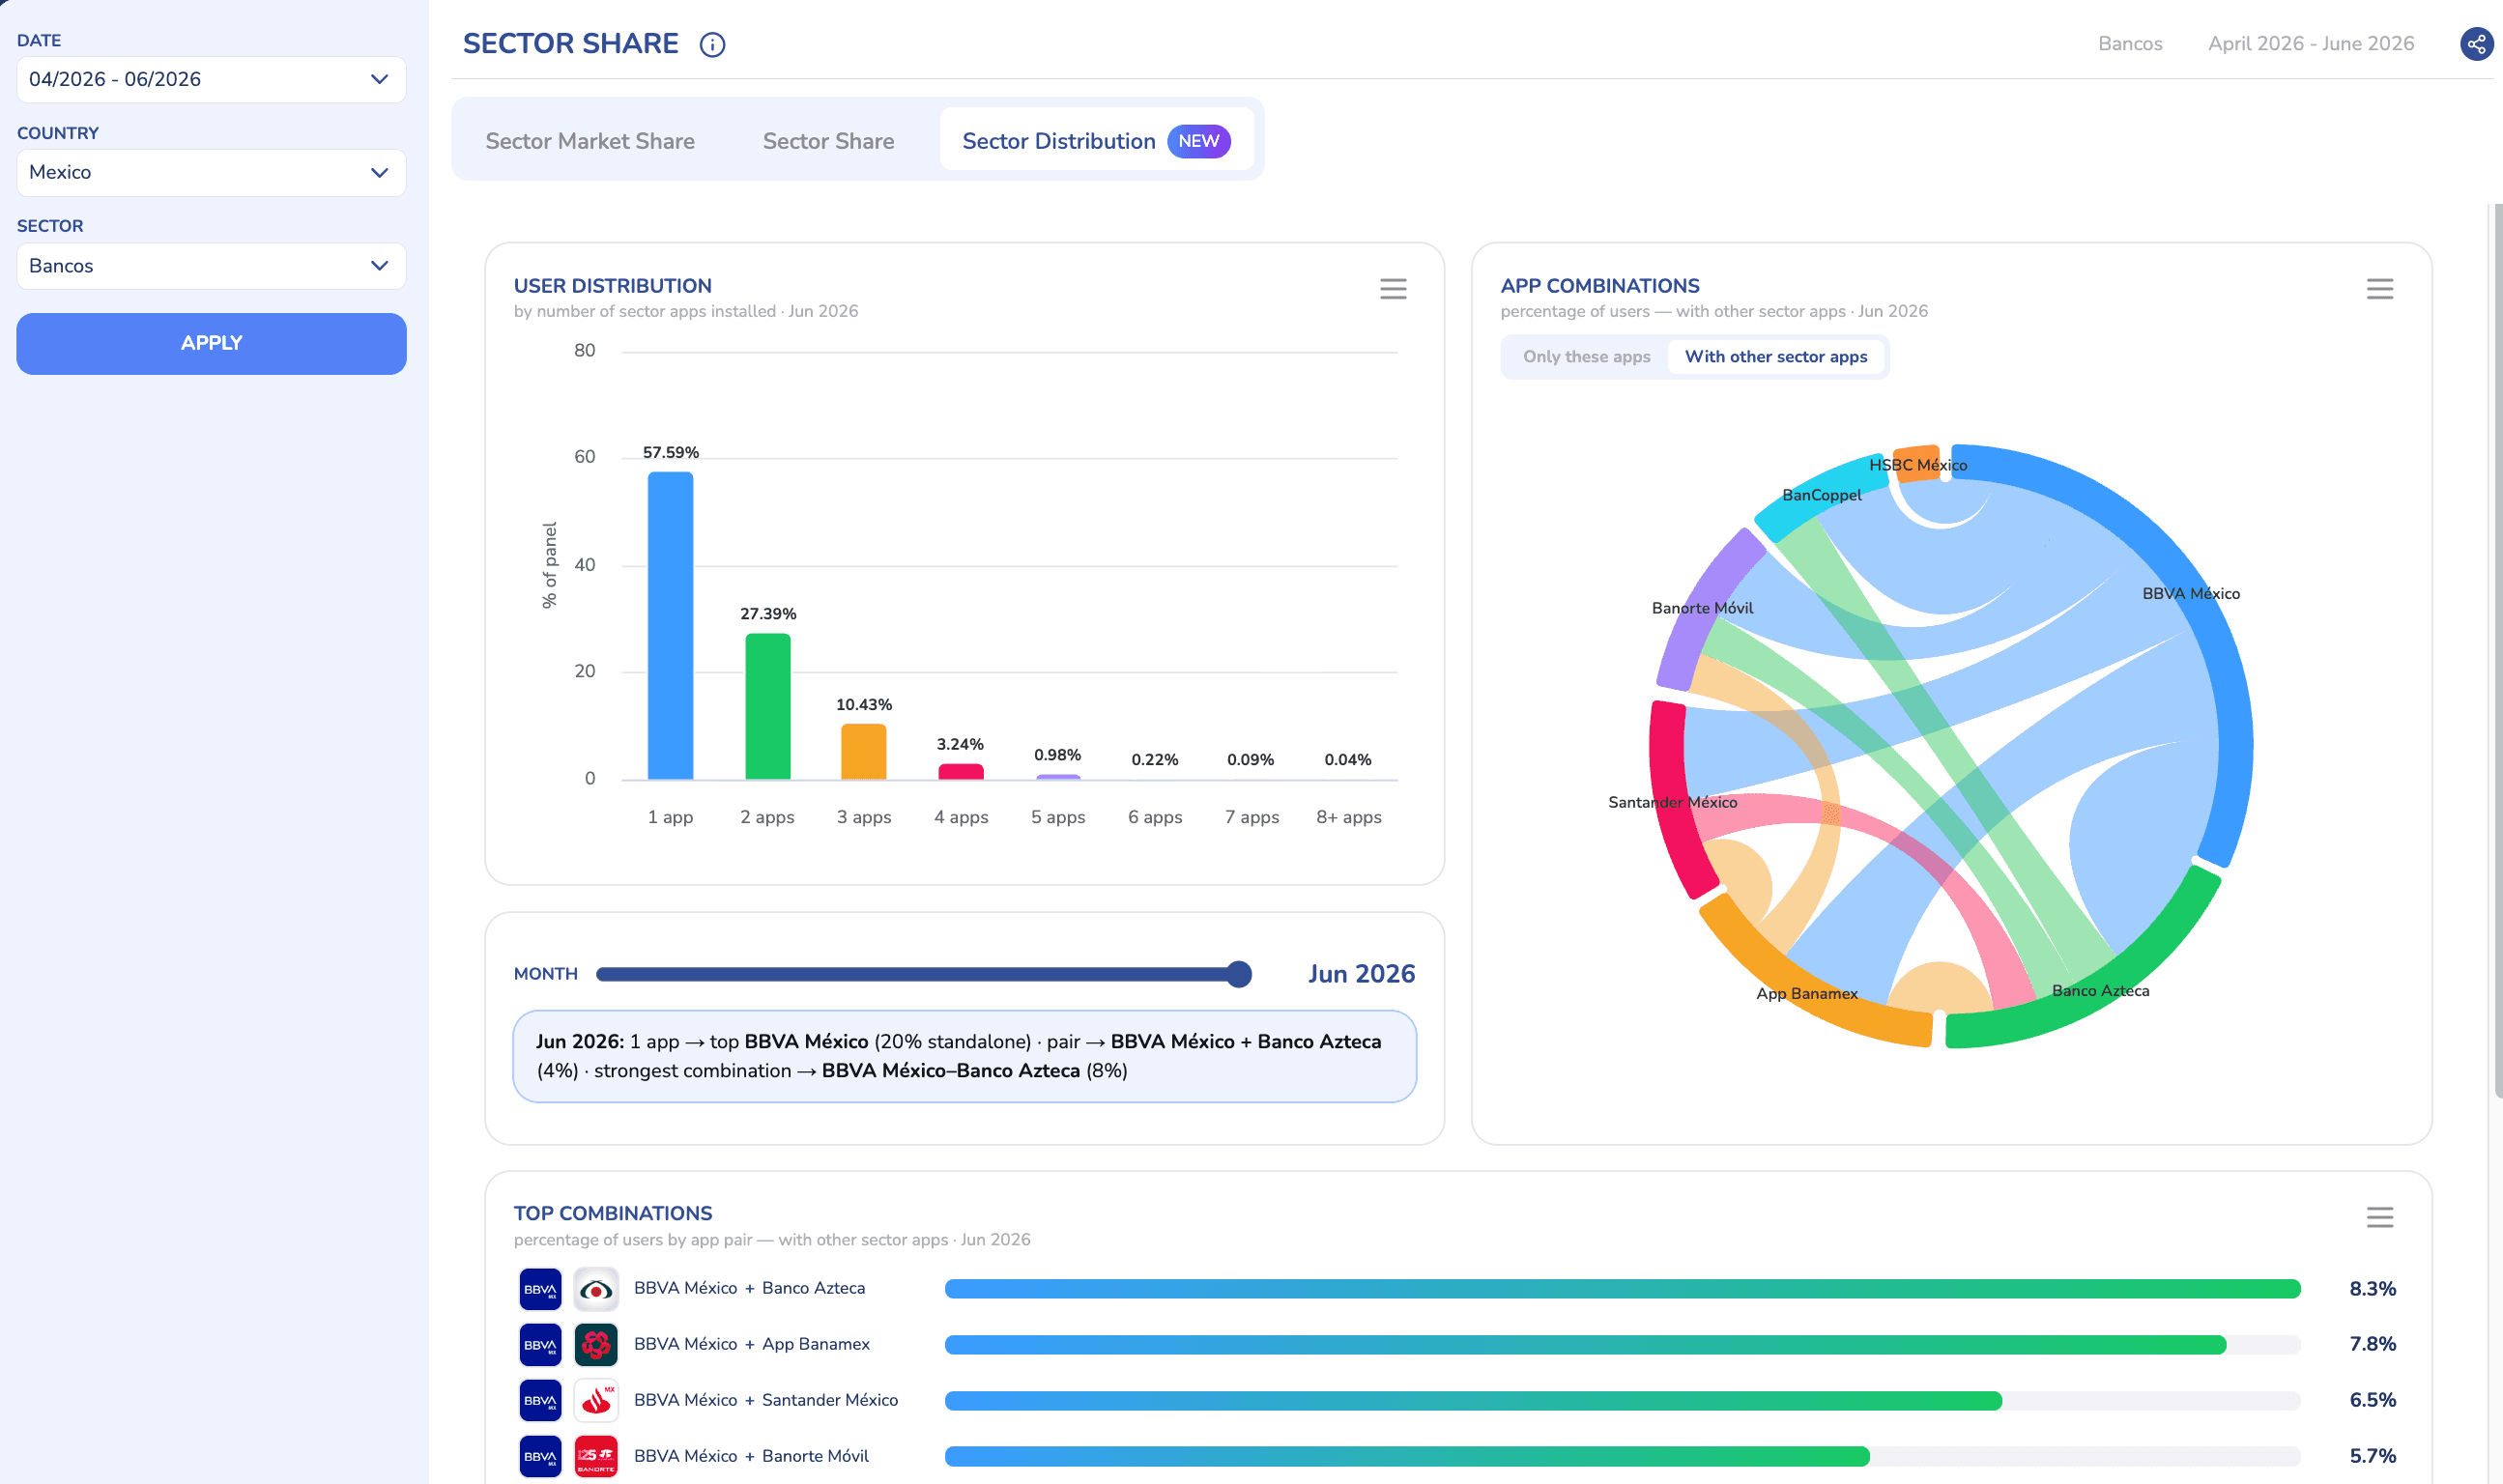
Exclusive users tell you how many are yours alone; affinity, which other apps you share them with. Together they show whether your app is the customer's main one or just another.
- Exclusive and shared users: how many use only your app and how many also use others'.
- Affinity: which other apps your users use, and in what proportion.
- Combinations within the sector: how many use your app and a competitor's at the same time.
Store
What the stores say about your app
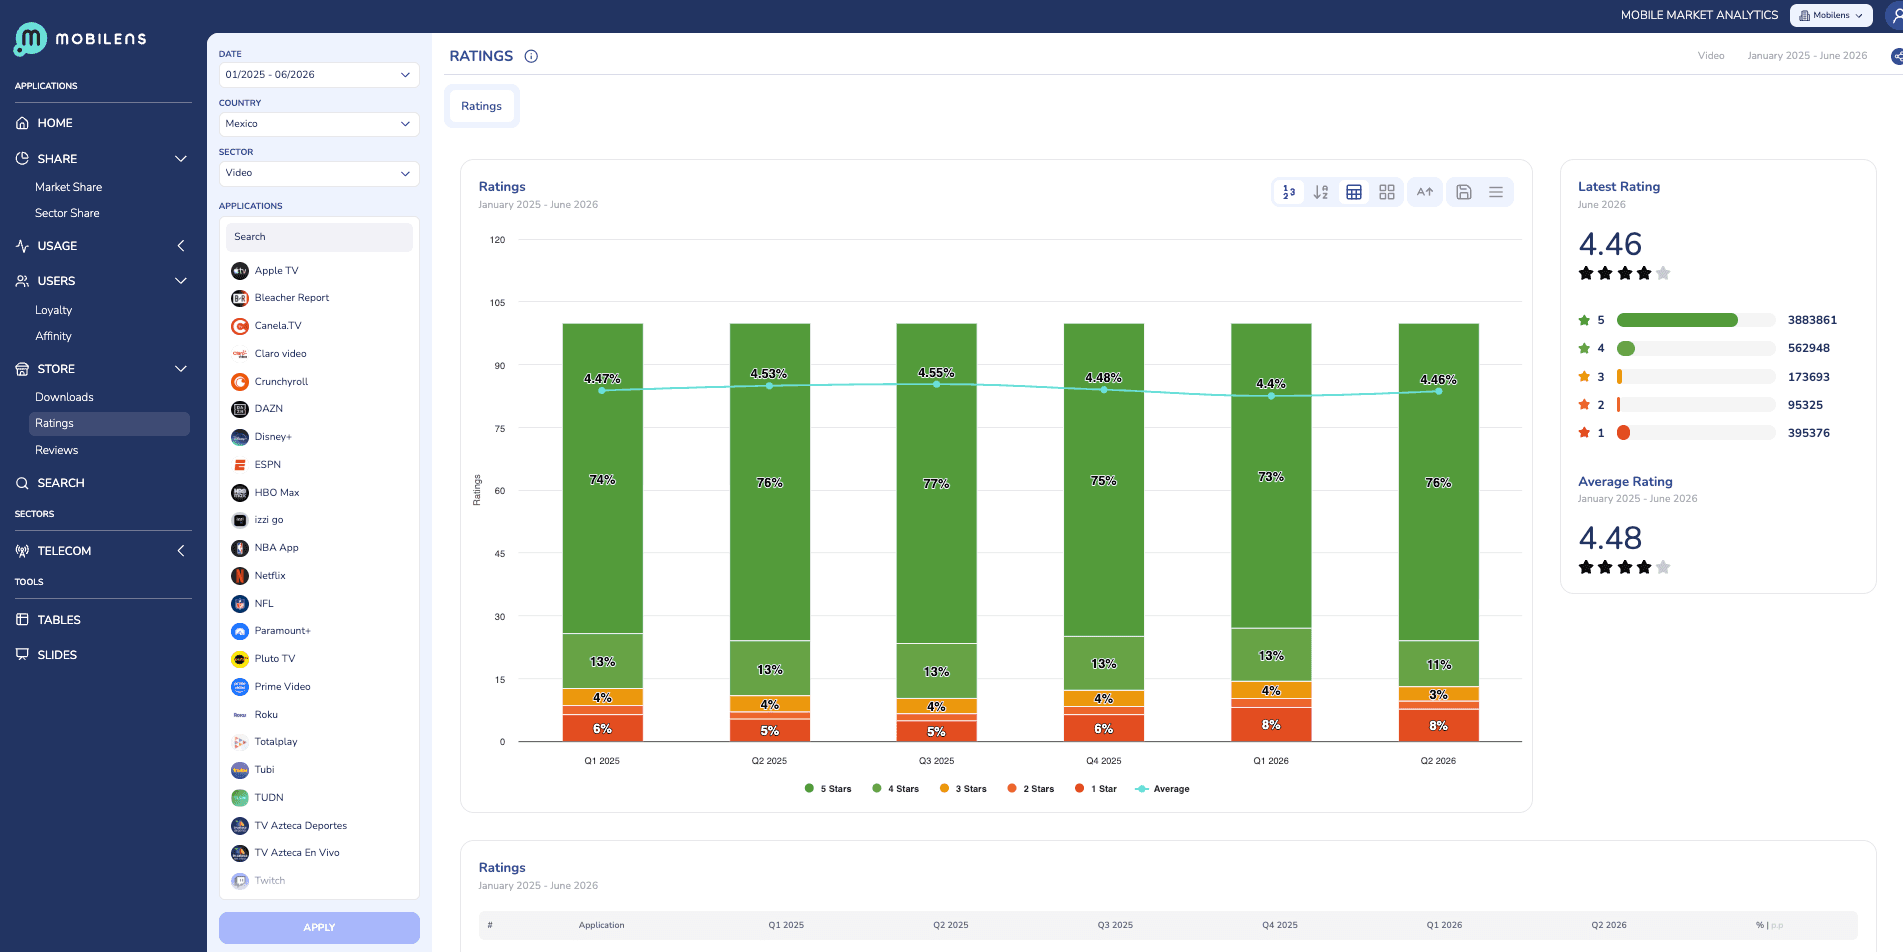
Downloads, ratings and reviews for every app, with the sentiment of the comments, to see how each release is received and compare it with the competition.
- Downloads and how they evolve.
- Average rating and breakdown by stars.
- Reviews classified by sentiment, to see what keeps coming up.
- 1,2 M
- apps tracked
- 49
- sectors analysed
- 9
- countries covered
Telecom and data consumption
What happens on the network, app by app
Because measurement happens on the device itself, DMI also sees how much data each app consumes, on which carrier and on which network technology. It is the view that store-based tools cannot give.
See it in a demoWhich apps consume the most data on each carrier?
How does consumption change with network technology?
What do each carrier's customers use on their phones?
The same data, read by each sector
We work with carriers, banks, retailers, media and agencies. Each one uses it to answer its own questions.
Carriers
Data consumption by app and by network, and what your customers use compared with your competitors'.
Banking and fintech
Whether your app is the customer's main one or a secondary one, and how many users you share with neobanks and digital wallets.
Retail and ecommerce
How many of your users also use the big marketplaces, and whether usage moves with your campaigns.
Media and agencies
Time spent compared with social networks and video, and which audience each outlet shares, to plan better.
How it is delivered
Mobilens is not a tool you buy with a credit card: it is a data service shaped around each client's questions.
Platform
Access to the indicators by app, sector and country, with filters, comparisons and historical series.
Reports
Regular reports on your sector and your competitors, ready to take to the board.
Analyst
A team that knows the data and helps you turn it into concrete decisions.
Frequently asked questions
Where does the data come from?
From a panel of people who use their phones as usual and have given explicit consent for their app usage to be recorded. The data is aggregated and anonymised: nobody receives information that identifies a person.
How is it different from app store data?
The stores tell you how often an app is downloaded. DMI measures what happens next: whether it is used, how much, who uses it and alongside which other apps. Store data is included too, as one more family of indicators.
Which markets and sectors does it cover?
Nine countries and 49 sectors, with over 2 million apps. If you need a specific market or sector, tell us and we will let you know whether we can measure it.
How do I get access?
We start with a demo on data from your sector. From there we agree which markets, sectors and indicators you need and how you prefer to receive them.
What do you need to measure?
Tell us your question and we will reply with a concrete case, not a brochure.